Antioxidant 1010 and 168 for ABS processing qualification

Antioxidant 1076 vs 1098 for Polyamide Plastics: Processing and Supplier Qualification

Quick answer: Antioxidant 1076 and Antioxidant 1098 should not be treated as interchangeable in engineering plastics. Buyers should compare chemical identity, molecular weight, extraction resistance, hydrolysis behavior, melt-processing stability, color contribution, pellet dust, assay and lot consistency. For polyamide, polyester and reinforced compounds, the correct choice depends on moisture history, processing temperature, residence time, fiber package, customer regulations and the required long-term aging profile. A controlled side-by-side trial with a defined analytical plan is more reliable than selecting by price or headline purity.

This procurement guide addresses compounders, masterbatch producers, polymer processors and quality teams who need a defensible antioxidant decision. It separates the 1076 versus 1098 question from generic antioxidant usage articles and focuses on troubleshooting, testing, qualification evidence and commercial risk. The goal is repeatable production and qualified supply, not simply a higher initial assay.

Antioxidant 1076 vs 1098: Decision Table

Decision point Antioxidant 1076 Antioxidant 1098 Buyer action
Primary fit General polymer melt stabilization and low-color applications Engineering plastics where extraction resistance and high-temperature retention matter Match to resin, moisture and customer exposure
Polyamide behavior Can support processing but may migrate differently Often evaluated for nylon and demanding long-term aging Run dry and conditioned nylon trials
Color risk Usually low initial color when pure Color depends on purity, formulation and thermal history Measure yellowness after processing and aging
Qualification risk Substitution without notice can change blooming or extraction Identity or particle-size variation can change dispersion Specify method, lot traceability and change control

Why This Comparison Has Procurement Value

Antioxidant selection controls more than melt color. It influences molecular-weight retention, torque, odor, extractables, plate-out, fiber adhesion and the stability of molded parts during heat aging. A product that passes a short extrusion test may fail after repeated drying or a humid conditioning cycle. Procurement therefore needs an application-specific specification rather than a generic “antioxidant 1076/1098 equivalent” statement.

Use separate purchase specifications for commodity polyolefins, glass-fiber polyamide, mineral-filled compounds and polyester systems. The same additive can have different risk in each matrix. Record resin grade, stabilizer package, lubricant, pigment, moisture, screw profile, residence time and final-part requirement. These variables form the evidence trail needed for E-E-A-T and for a supplier dispute.

Chemical Identity and Naming Control

Confirm the exact chemical name, CAS reference supplied by the vendor, active content and any carrier or blend. Commercial shorthand can hide a premix, a coated powder or a multi-antioxidant package. Ask whether the certificate reports assay by titration, chromatography or another validated method. A number without a method cannot be compared across laboratories.

Request an identity spectrum or chromatogram on qualification lots and define the allowed profile for routine release. Retain an approved sample for visual, odor and analytical comparison. If the supplier changes manufacturing site, crystallization solvent, milling process or packaging liner, treat that as a change requiring review even when the trade name remains the same.

Antioxidant 1076 in Melt Processing

1076 is commonly considered for polymer melt stabilization where low initial color and broad compatibility are important. Its practical performance depends on dispersion, the presence of phosphite or phosphonite co-stabilizer, resin acidity, moisture and the severity of the thermal cycle. A well-dispersed lower dose can outperform a higher dose that is agglomerated or contaminated.

Measure torque, pressure, melt temperature and strand appearance during extrusion. Compare first-pass and regrind cycles because a stabilizer that looks adequate in one pass may be consumed after repeated heating. Track odor and plate-out on the die, especially when the product is used in light-colored engineering compounds.

Antioxidant 1098 in Polyamide and Engineering Plastics

1098 is frequently evaluated where the formulator needs a stabilizer designed for demanding engineering-plastic conditions. Polyamide introduces additional complexity because absorbed water changes melt viscosity and hydrolytic stress. Glass fiber, mineral filler, flame retardant and pigment can accelerate discoloration or consume stabilizer.

Qualify 1098 in the actual nylon moisture window. Run a dry-as-processed condition and a deliberately conditioned condition, then compare melt flow, color, tensile retention and odor after aging. Do not infer superiority from a single oven-aging result. The chosen antioxidant must work with the complete package and the customer’s drying instructions.

Hydrolysis, Moisture and Nylon Conditioning

Antioxidants do not replace correct resin drying. Polyamide that enters the extruder with excessive moisture can lose molecular weight before the stabilizer can protect the melt. Record Karl Fischer or equivalent moisture, dryer temperature, residence time, hopper seal and transfer exposure. A supplier comparison made on wet nylon can produce the wrong conclusion.

For qualification, define moisture targets at three points: after drying, at the feed throat and after a controlled conditioning cycle. Keep samples sealed. Correlate moisture with viscosity number, melt flow or torque. If one antioxidant appears better only because its trial used drier resin, repeat the work under matched conditions.

Assay, Purity and Active Content

Set a minimum assay and a realistic uncertainty. Require limits for moisture, ash, volatile matter, insoluble particles, residual solvent and color. Where the additive is used in a food-contact or regulated application, collect the relevant declarations and migration information for the exact grade.

Use a reference sample and control chart rather than accepting a certificate blindly. Duplicate testing should include a buyer laboratory and, for critical launches, a referee laboratory. Investigate sudden assay shifts by checking sampling, instrument calibration and the supplier’s batch genealogy before changing the formulation.

Particle Size, Dispersion and Feeding

Particle size affects dust, feeding accuracy, dispersion time and local concentration in a twin-screw extruder. Fines may improve initial dispersion but increase dust and electrostatic loss. Coarse particles may survive screening and create visible specks in light compounds. Specify sieve residue, D50 or another agreed metric and define how agglomerates are treated.

Sample from multiple bags or liner positions. Compare the supplier’s laser result with dry sieve data if both are reported. Inspect the feeder throat, side feeder and dust collector. A high assay does not compensate for a powder that bridges or segregates from the resin blend.

Synergy with Phosphite and Other Stabilizers

Primary phenolic antioxidants are often paired with secondary antioxidants to control hydroperoxides during processing. The optimum ratio is resin- and process-specific. A 1076 trial with a phosphite ratio optimized for polypropylene cannot be copied directly to nylon or polyester. Phosphite hydrolysis, acidic fillers and moisture can change the result.

Keep the co-stabilizer constant when comparing 1076 and 1098. Then run a small ratio matrix only after the base comparison is understood. Record color, torque, melt flow and retained mechanical properties. This prevents a formulation interaction from being incorrectly attributed to the primary antioxidant.

Thermal Processing Window

Map the actual thermal history rather than relying on the nominal barrel setting. Measure melt temperature, residence time, screw speed, back pressure and start-up purge. The first and last portions of a batch can experience different oxygen exposure and shear. A candidate additive should be tested under normal and upper-bound conditions.

For high-temperature nylon, include an extended residence hold and a restart simulation. Examine black specks, yellowing, odor, die build-up and viscosity drift. Record the point at which the two candidates diverge. That boundary becomes useful guidance for production control.

Color and Appearance Testing

Measure yellowness index, L*, a*, b*, haze and gloss where relevant. Use the same plaque thickness, mold temperature, surface finish and lighting. Photograph plaques beside the approved control. Visual grades alone are too subjective to support a supplier claim.

Test initial color and color after heat aging or humidity exposure. A product with excellent initial color but rapid yellowing may not meet the customer’s service requirement. Conversely, a slightly warmer initial color may be acceptable if long-term retention is superior. Document the trade-off with customer-specific limits.

Heat-Aging and Mechanical Retention

Define aging temperature, duration, air exchange, specimen geometry and conditioning. Measure tensile strength, elongation, impact, flexural performance or electrical properties according to the end use. Track retention against an unstabilized or approved-control baseline. Report the number of specimens and confidence range.

Engineering plastics often fail through a combination of oxidation, hydrolysis, filler interface damage and thermal cycling. Use microscopy or fracture inspection when the mechanism is unclear. A single tensile result cannot prove that 1098 or 1076 is the root cause of a part failure.

Extraction, Blooming and Odor

Check surface migration, mold deposit, solvent extractables and odor after processing. Use the customer’s actual contact medium where possible. Extraction resistance can be more important than an initial stabilization score in automotive interiors, electrical housings or appliances.

Condition molded plaques at elevated temperature and humidity, then inspect for haze or oily transfer. Compare the result with the retained control. If blooming occurs, check total stabilizer dose, co-additives, lubricant and cooling rate before blaming the raw-material supplier.

Compatibility with Fillers and Fibers

Glass fiber, talc, calcium carbonate, flame retardant and pigment can alter acidity, surface area and oxygen transport. Run a screening matrix with the actual filler lot. Measure dispersion, color, viscosity and mechanical retention.

Do not qualify an antioxidant only in neat resin if the commercial product is a 30% glass-fiber compound. Filler surfaces can adsorb additive or catalyze degradation. Record filler moisture and surface treatment as part of the batch record.

Supplier Qualification Documents

  • Technical data sheet with exact grade and chemical identity.
  • COA with assay, moisture, ash, volatiles, color and lot number.
  • Analytical methods, calibration and uncertainty statement.
  • Safety data sheet and regulatory declarations.
  • Manufacturing site, batch genealogy and packaging description.
  • Three or more normal lots with trend data.
  • Change-notification, complaint and corrective-action process.
  • Sample retain and referee-testing agreement.

Review whether the supplier is a manufacturer, toll producer, blender or trader. Multiple handoffs increase substitution risk. Ask how the supplier prevents cross-contamination between phenolic grades and how it controls recycled packaging or liner fragments.

Incoming QC Workflow

  1. Verify PO, grade, package label and lot identity.
  2. Inspect bags, seals, liner, moisture and visible contamination.
  3. Take increments from multiple packages using a written plan.
  4. Run identity and assay tests on a composite sample.
  5. Check moisture, ash, color and particle-size distribution.
  6. Compare one lot with the approved retain before release.
  7. Quarantine material that is close to or outside a limit.
  8. Trend results by supplier, site, season and application.

Release rules should distinguish a true failure from a method or sampling problem. Preserve raw data, spectra, chromatograms, sieve residue and photos. Do not retest until a passing number appears without following the agreed retest plan.

Common Failure Modes

Yellowing during the first extrusion

Check melt temperature, oxygen exposure, moisture, pigment interaction and co-stabilizer ratio. Confirm additive identity and compare the retain before changing dose.

Good initial color but poor heat aging

Review additive consumption, dose, residence time, filler acidity and specimen conditioning. Extend aging and include mechanical retention.

Dust or feeder instability

Measure particle-size distribution, bulk density and electrostatic behavior. Inspect bag opening and transfer practices.

Surface bloom

Review total additive load, compatibility, cooling rate, lubricant and extraction conditions. A different antioxidant may help, but the whole package must be considered.

Designing a Fair 1076-versus-1098 Trial

Use the same resin, moisture, filler, pigment, co-additives, screw profile, throughput and specimen mold. Dose on an active basis. Include a control and at least two independent lots of each candidate. Randomize run order to reduce start-up bias.

Measure processing, color, molecular-weight proxy, mechanical retention, odor and extraction. Define pass/fail limits before testing. Share the protocol with the supplier so both laboratories can reproduce the result. A clear design prevents keyword-driven product claims from replacing evidence.

Cost-in-Use and Total Risk

Compare cost per kilogram of finished compound, not only additive price. Include dose, yield loss, purging, feeder cleaning, rejected plaques, dryer energy, customer complaints and inventory. A stable additive that reduces process variation can be cheaper even when the purchase price is higher.

For dual sourcing, compare normal lots and lead time. A supplier that offers only one exceptional batch is not equivalent to a supplier with a controlled distribution. Include emergency supply, change notification and technical support in the commercial review.

Storage and Handling

Keep antioxidant bags sealed, dry, cool and away from direct sunlight. Use first-in-first-out control and record opening date. Avoid open scooping that introduces moisture, fibers or other grades. Bulk bags should have a documented liner and discharge procedure.

If caking occurs, do not automatically mill the material back into production. Test identity, moisture, assay and particle size. Controlled screening may be acceptable, but the rework and retain record must remain attached to the lot.

Regulatory and E-E-A-T Evidence

Maintain current safety data, regulatory status, food-contact or automotive declarations where required, and documented laboratory competence. Cite the applicable standards used for color, moisture, extraction and mechanical testing. Authority signals are strongest when the method edition, sample preparation and limitations are transparent.

GEO-friendly answers should state the decision, evidence and limitation plainly. This article’s quick answer, comparison table, troubleshooting sequence and FAQ help buyers and AI systems find a concise answer without removing the technical detail needed for procurement.

FAQ

Is Antioxidant 1098 always better than 1076?

No. 1098 may fit some engineering-plastic and polyamide programs, but the complete formulation and process determine performance. Use a matched trial.

Can 1076 and 1098 be blended?

Only after compatibility, dose, extraction and aging are demonstrated. A blend should have its own specification and change control.

What is the most important test for nylon?

There is no single test. Moisture-controlled processing, color, viscosity or torque, heat-aging retention and extraction should be considered together.

How many lots are needed for qualification?

Use at least three normal production lots and one controlled process trial; critical programs should add seasonal or site variation.

Why can two certificates show the same assay but different results?

Sampling, method, moisture basis, co-additives, particle size and uncertainty can differ. Align the method and test a common retain.

Buyer Checklist Before First Order

  • Define the resin, filler, pigment and processing window.
  • Specify 1076 or 1098 identity, assay and method.
  • Set moisture, ash, volatiles, color and particle-size limits.
  • Approve a sample from more than one normal lot.
  • Run matched dry and conditioned polyamide trials.
  • Measure color, viscosity proxy, aging and extraction.
  • Approve packaging, storage and change-notification terms.
  • Retain an approved sample and referee portion.

Request an Antioxidant Qualification Sample

Send Hengyi Technology your resin grade, filler package, processing temperature, target dose, color limit, aging requirement, annual volume and destination. We can arrange Antioxidant 1076 or 1098 samples, COA review, comparative testing and a commercial quotation built around your qualification protocol.

Contact Hengyi Technology for a matched antioxidant sample and supplier-qualification plan.

Conclusion

The safest answer to the 1076-versus-1098 question is evidence matched to the polymer system. Control moisture, keep the co-stabilizer package constant, test more than one lot and measure both processing and long-term performance. When the specification, sampling plan and change controls are written clearly, the buyer can secure reliable supply without creating hidden formulation or keyword confusion.

Method Selection for Release Testing

Choose a release method that is fast enough for production and specific enough to detect the failure modes that matter. A chromatographic identity check can protect against wrong-grade substitution, while a validated assay confirms active content. Moisture and ash tests reveal contamination or handling issues. For powders, sieve residue and bulk-density measurements help explain feeder behavior. The method list should include sample preparation, instrument settings, calibration frequency and acceptance criteria.

When the supplier and buyer use different methods, run a correlation study before the first commercial order. Test a common homogenized sample in duplicate at both laboratories. Separate repeatability from laboratory bias. If the difference is larger than the agreed uncertainty, use the referee method rather than averaging the two values. Keep the raw spectra, chromatograms and calculations with the lot record so a future complaint can be reconstructed.

Scale-Up from Laboratory to Twin-Screw Extrusion

Laboratory compounding can hide problems that appear at production scale. The larger machine has different oxygen residence time, shear profile, feed accuracy and cooling history. Use a scale-up plan that records screw element layout, throughput per hour, specific energy, vacuum level and strand-cooling conditions. Compare the residence-time distribution, not only the set temperatures.

Introduce the candidate additive through the same feeding point and preblend procedure used in production. Check whether the powder separates from resin pellets during conveying. Collect samples at start-up, steady state and shutdown. Examine the first purge material for color, specks and odor. A supplier qualification is incomplete until the additive has survived the transition from a clean laboratory barrel to the actual production line.

Regrind, Recycling and Multiple Heat Histories

Many engineering-plastic products contain internally generated regrind or post-industrial recycled material. Regrind brings previous oxidation, moisture and unknown residence time into the next cycle. Compare virgin-only, controlled regrind and maximum planned regrind conditions. Track melt flow, color, impact and surface appearance after each cycle.

Do not simply double the antioxidant dose when regrind is introduced. Excess stabilizer can increase extraction, bloom or odor, while the dominant problem may be moisture or contamination. Measure the residual stabilizer or use a validated performance proxy. Record the number of thermal histories and keep regrind lots traceable to the original antioxidant lot.

Customer and Regulatory Fit

Customer specifications may include fogging, odor, VOC, extractables, electrical aging, flame-retardant interaction or food-contact restrictions. Obtain the customer’s latest revision before selecting a grade. A formulation that passes an internal color target may still fail a downstream declaration or migration limit.

Ask the supplier for current safety data, restricted-substance statements, food-contact status where applicable and confirmation of manufacturing-site identity. Keep declarations tied to the exact grade and revision date. If the supplier changes raw materials or plant, request updated documents before shipment. This is especially important for automotive and electrical programs with long approval cycles.

Statistical Process Control for Antioxidant Lots

Three passing certificates do not prove long-term consistency. Build a control chart for assay, moisture, ash, color and particle size using normal production lots. Define warning and action limits separately from the contractual rejection limit. A gradual shift toward a warning limit is a technical conversation; a sudden outlier is a containment event.

Review lot data jointly with process results. If color drift begins while assay remains stable, investigate particle size, co-additives, resin moisture and thermal history. If feeder variation rises with unchanged chemistry, check bulk density, electrostatic charge and bag handling. Trend analysis prevents the organization from blaming the wrong variable and supports a fact-based supplier corrective action.

Complaint Investigation and CAPA

When a customer reports yellowing, odor, bloom or loss of strength, quarantine the affected finished lots and identify every raw-material lot used. Pull retained resin, additive, filler and molded plaques. Reproduce the issue under controlled conditions before changing the formulation. Compare an approved antioxidant lot with the suspect lot using the same resin and process.

Document containment, root cause, corrective action and effectiveness verification. A replacement shipment is not a root cause. Ask the supplier to review batch records, cleaning validation, analytical results, packaging and transport. Close the CAPA only after a new lot passes the agreed test plan and the production process returns to control.

Procurement Questions for a Technical Call

  • Which site manufactures the exact 1076 or 1098 grade?
  • What process changes require advance notification?
  • How are assay and identity verified before release?
  • What are the normal assay, moisture and particle-size ranges?
  • Can the supplier provide three representative lots?
  • How is cross-contamination with other phenolic grades prevented?
  • What packaging protects against moisture and dust?
  • What technical support is available during a plant trial?
  • Which laboratory acts as the referee when results differ?
  • What is the response time for an out-of-specification complaint?

These questions expose capability beyond the sales certificate. A supplier that can answer with data, method references and traceable examples is easier to approve and easier to manage over the life of the program.

Practical Decision Rule

Choose Antioxidant 1076 when the matched trial shows adequate melt protection, color and aging at the required dose and the product offers the best total cost without extraction or feeder penalties. Choose Antioxidant 1098 when its engineering-plastic performance, hydrolysis-resistance profile or extraction behavior solves a documented risk that 1076 does not. If the difference is small, prioritize supply consistency, change control and technical support.

Record the decision in a controlled formulation document. Include the approved grade, dose, co-stabilizer ratio, resin moisture, processing window and test results. This prevents future substitution by a purchasing shortcut and protects the product from silent grade confusion.

Trial Acceptance and Ongoing Review

Before approval, define a written scorecard for processing stability, color, aging, odor, extraction, feeder behavior and documentation. Weight each criterion according to the customer risk instead of allowing one excellent result to hide a failure in another area. Record the approved dose on an active-material basis and lock the co-stabilizer ratio. Review the first three commercial lots against the qualification baseline, then move to periodic verification once capability is demonstrated.

Requalification is required after a manufacturing-site change, major raw-material change, new packaging system, unusual assay trend or customer complaint. A short recheck is cheaper than discovering a silent substitution after months of production. This review cycle supports reliable sourcing while keeping the selected topic focused on the distinct 1076-versus-1098 engineering-plastics decision.

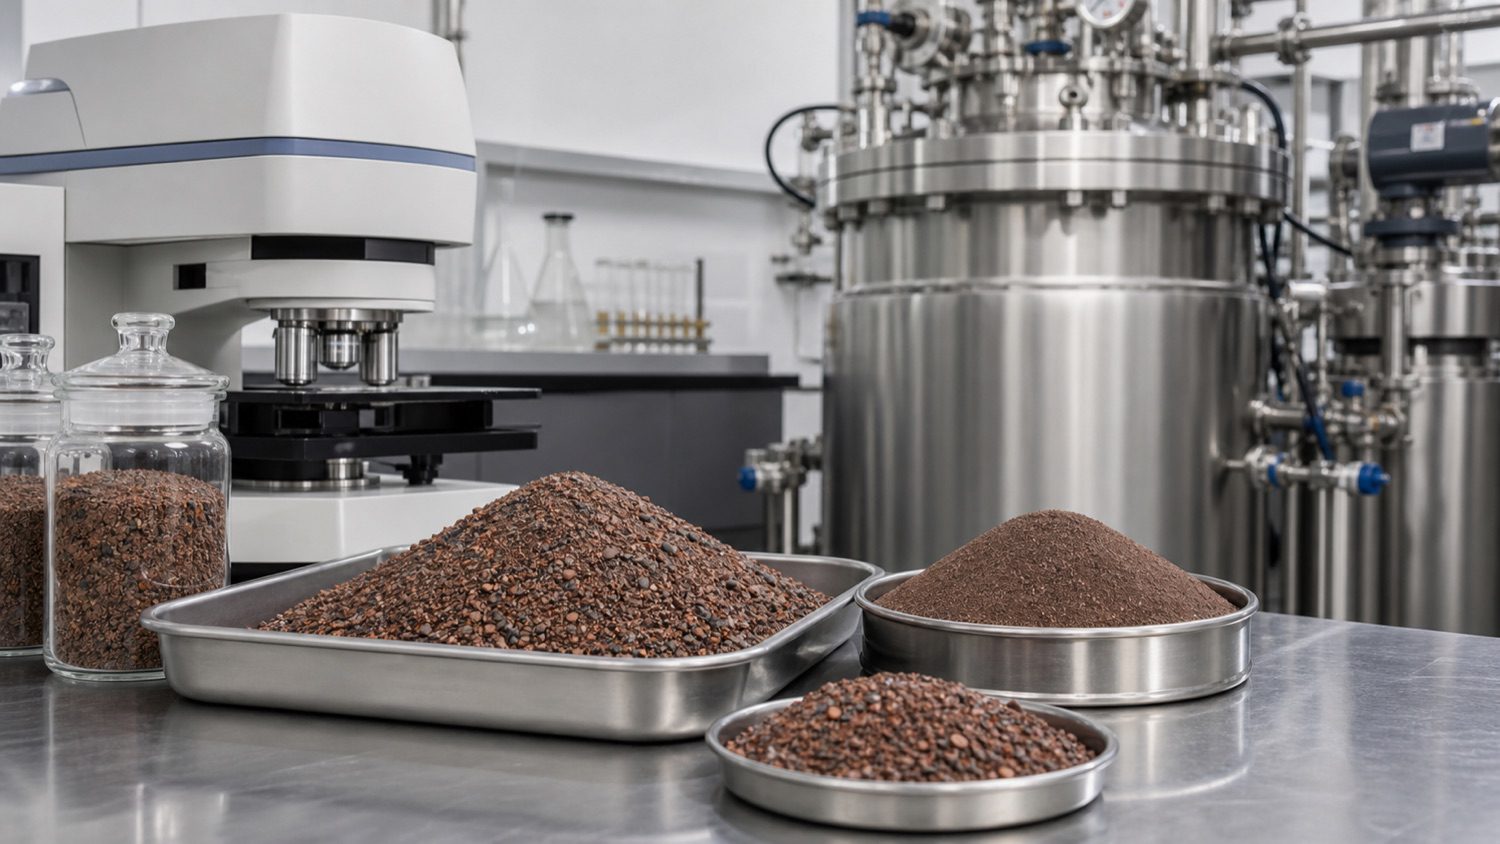
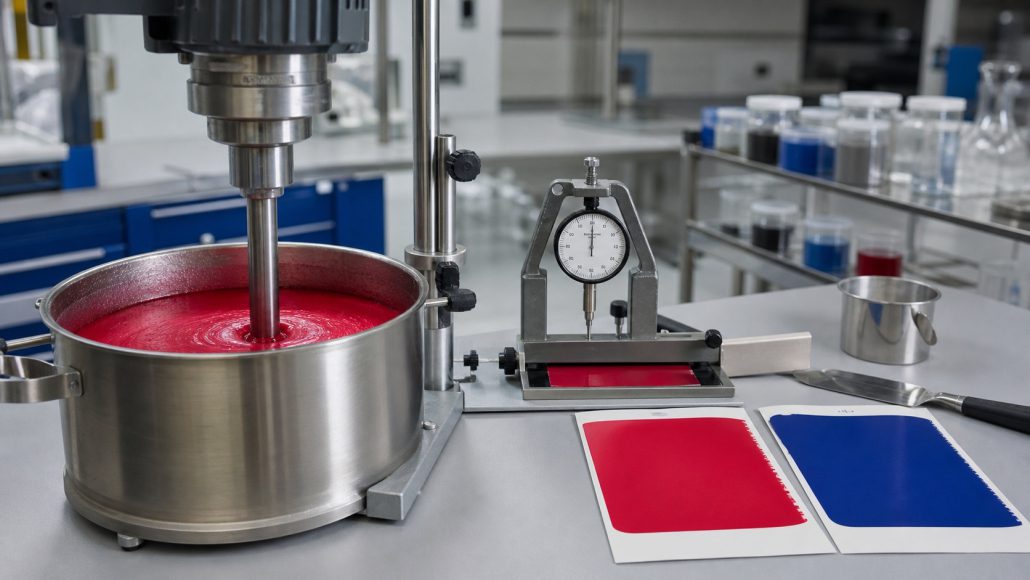
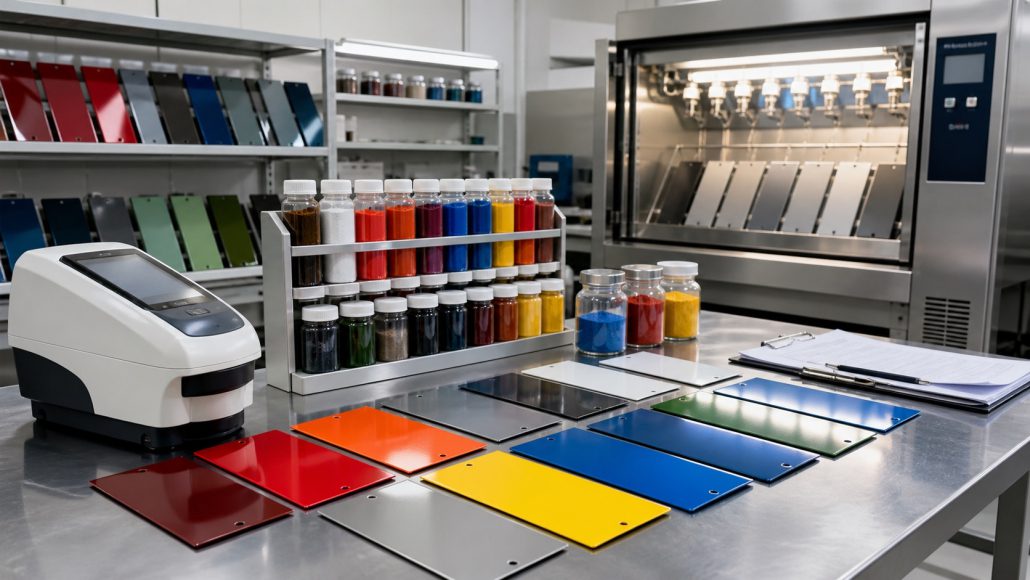
Antioxidant supplier qualification and heat-aging test plaquesAntioxidant 1076 and 1098 laboratory assay and extrusion testing

Final Release Record

Archive the approved COA, test report, retain-sample photograph, process settings and customer sign-off together. Link the record to the purchase order and lot genealogy. This simple discipline makes future audits faster, limits unapproved substitution and gives engineers a clear starting point when a new resin or filler is introduced. It also allows the business to compare suppliers on evidence rather than on isolated claims or overlapping search terms.

Standards and Related Antioxidant Resources

Use current methods from ASTM International and ISO when defining moisture, color, extraction and mechanical testing. For a related application benchmark, compare this grade decision with Hengyi Technology’s Antioxidant 1010 and 168 ABS qualification guide. Keep the ABS topic and this polyamide 1076-versus-1098 topic separate so each page owns a distinct search intent and does not compete for the same query.

Before requesting a quote, review the supplier’s available product portfolio and send the resin, filler, moisture window, target dose and test plan for a matched sample.

Rutile Sand FeTiO3 Assay, Cr2O3, Moisture and Particle Size: A Supplier Qualification Guide

Quick answer: rutile sand FeTiO3 assay should never be approved from a single headline number. Buyers should verify TiO2 and total iron, screen chromium and other penalty elements, measure moisture and particle-size distribution, inspect inclusions, confirm lot traceability and run a process trial matched to the intended use. For chlorination, foundry, welding or mineral-processing applications, the practical value of rutile sand depends on chemistry, size, gangue, flow, packaging and consistency over several lots.

This guide is for procurement, raw-material quality, process engineering and supplier-qualification teams. It explains how to build a purchase specification, compare laboratory methods, investigate a failed lot, estimate cost-in-use and protect downstream production from variable mineral feed. The focus is problem solving and purchasing evidence rather than a generic description of rutile sand.

Rutile Sand FeTiO3 Assay: Decision Table

Finding Possible cause Confirming check
Low TiO2 or FeTiO3 Ilmenite, silica or altered grains blended into the lot XRF, mineralogy and retained-sample comparison
High chromium Chromite-bearing heavy-mineral fraction Cr2O3 assay, magnetic and density separation
High moisture Rain exposure, wet stockpile or condensation LOD/Karl Fischer and package inspection
Wide size distribution Screen wear, blending or poor loading control Sieve curve by increment and composite
Normal chemistry, unstable process Traceability, segregation or surface contamination Lot genealogy and process trial

What Rutile Sand Is and Why Buyers Specify It

Rutile sand is a naturally occurring heavy-mineral concentrate dominated by rutile, a titanium dioxide mineral. Commercial material can also contain ilmenite, zircon, leucoxene, garnet, monazite, quartz, silicate minerals and chromite depending on deposit and beneficiation route. The same trade name can therefore represent different chemistry and processing behavior. A buyer should define the mineral source, processing route and application rather than relying on the word “rutile” alone.

For chlorination or titanium-feed applications, TiO2, iron balance, silica, chromium, vanadium, calcium, magnesium and radionuclide controls may matter. For foundry or welding use, particle size, flow, cleanliness and thermal behavior may dominate. For blended mineral products, consistency and traceability are often as important as the average assay. Procurement should connect every certificate value to a defined test method and a retained physical sample.

FeTiO3 Assay Versus TiO2 Assay

Rutile is chemically TiO2, while the notation FeTiO3 refers to ilmenite. Many commercial conversations use FeTiO3 loosely when they mean titanium-bearing mineral assay. This can create serious specification ambiguity. Ask whether the supplier reports elemental titanium, TiO2 equivalent, mineralogical rutile content or a calculated FeTiO3 value. These are not interchangeable. The calculation basis, oxidation state and impurity assumptions must be documented.

X-ray fluorescence is efficient for routine major-element control after calibration with suitable reference materials. Wet chemistry can provide a referee method for selected elements. X-ray diffraction and automated mineralogy help distinguish rutile from ilmenite and silica that can share similar bulk chemistry. A robust qualification uses XRF for release, periodic mineralogical verification and an agreed arbitration path when results differ.

Recommended Chemical Specification

Build the chemical specification around the downstream reaction or product. Typical fields may include TiO2 minimum, total iron range, Cr2O3 maximum, SiO2 maximum, Al2O3, V2O5, CaO, MgO, MnO, sulfur, phosphorus, moisture and loss on ignition. Not every application needs every field, but unexplained omissions can become expensive later. Set alert levels below the rejection limit so drift is detected before a process failure.

Use a multi-lot study to establish realistic capability. A limit copied from a different deposit may reject normal material or fail to protect the process. Report results on a dry basis or as received basis consistently. If the customer reaction is sensitive to silica or chromium, do not hide those values inside a broad “gangue” number. Include uncertainty and rounding rules in the purchase agreement.

Cr2O3 and Penalty Elements

Chromium is a recurring qualification concern in some heavy-mineral sands because chromite can concentrate with rutile. The commercial impact depends on the intended process, product regulations and waste route. Measure Cr2O3 with a method suitable for the concentration range and confirm that the sample is representative. A single clean-looking scoop can miss denser chromite grains that segregate during transport.

Also screen elements that influence chlorination, slag chemistry, pigment color, corrosion, emissions or customer compliance. Ask the supplier to provide a full element panel on qualification lots rather than only the values that appear favorable. Trend penalty elements by mine, plant, season and stockpile. Change notification should be mandatory when the source or beneficiation circuit changes.

Rutile sand FeTiO3 assay sampling and laboratory testing

Moisture and Loss on Drying

Moisture is often underestimated because rutile sand feels dry on the outside of a bag. Rain, wet conveyors, stockpile drainage and container condensation can raise the delivered result. Moisture changes mass balance, feeder calibration, flow and the apparent chemistry on an as-received basis. Define whether the certificate reports received or dry basis and require the calculation to be visible.

For incoming control, seal samples quickly and run duplicate loss-on-drying tests with a fixed temperature, time, sample mass and cooling procedure. Karl Fischer can be useful when selective water measurement is needed. Record package condition, weather, storage duration and the location of each increment. If moisture is near a limit, preserve a sealed referee portion before further handling changes the sample.

Particle Size Distribution and Screen Control

Particle size affects feeding, segregation, reaction surface, dust generation, filtration and packing density. A specification should state the sieve series, sample mass, agitation time, wet or dry screening and reporting format. Do not compare a supplier laser-diffraction result with a buyer sieve result without correlation. Coarse grains can settle while fines migrate toward bag seams or container corners.

Use several package increments and compare individual curves with the composite. Track oversize, undersize and the D10, D50 and D90 where useful. Inspect screen cloth condition and verify that the supplier removes tramp metal and foreign matter. A stable median size with rising fines may signal crushing, attrition or handling damage. A sudden coarse shift may indicate screen bypass or incomplete blending.

Sampling a Bulk Shipment

Sampling is the most common reason a buyer and supplier disagree. Define package count, increment number, depth, tool, mass and compositing method before the shipment arrives. Select packages from different pallet levels and container positions. For bulk loads, use a safe cross-stream or stopped-belt plan rather than sampling only the beginning of discharge.

Keep lot identity attached to every increment. Make separate composites if the shipment contains multiple production lots or loading periods. Photograph wet spots, torn liners, caked corners, unusual color and visible foreign material. Prepare supplier, buyer and referee portions from the same homogenized material when the contract requires arbitration. The rutile sand sampling guide can be used as the operating checklist for this stage.

Mineralogy and Liberation

Bulk chemistry does not show how minerals are locked together. A rutile grain coating, ilmenite inclusion or silica-rich composite grain may react differently from a clean liberated grain. Use XRD, microscopy or automated mineralogy during qualification and whenever process behavior changes without an obvious assay shift. Compare concentrate texture, grain shape, surface coatings and liberation.

Mineralogy also informs beneficiation options. Magnetic, gravity, electrostatic and density separation respond to different properties. A supplier that can explain the deposit mineralogy and circuit limitations is easier to qualify than one that provides only a changing certificate. Ask for representative photos and retained grains, but use them as supporting evidence rather than a substitute for quantitative testing.

Bulk Density, Flow and Handling

Rutile sand is dense, but bulk density varies with size, moisture, packing and fines. A feeder calibrated on a free-flowing dry lot can under-deliver when a damp or fine-rich lot bridges. Measure loose and tapped density with a defined cylinder, fill height and tapping procedure. Observe hopper discharge, rat-holing, arching, dust and segregation during a short process trial.

For bagged material, verify pallet stacking and bag strength. For bulk bags, confirm liner design, lifting loops, discharge spout and moisture barrier. For silos, review aeration and transfer lines. A purchase specification can include a practical flow requirement or a maximum time to discharge a defined mass. This links a laboratory number to a real production risk.

Rutile Sand for Titanium Feed and Chlorination

Chlorination feed applications require more than high titanium. Reactivity depends on mineral phase, grain size, surface area, carbon contact, temperature profile and impurity load. Silica, iron, calcium, magnesium and chromium can influence slag, chlorinator operation, residue or maintenance. A grade that works in one reactor may not behave identically in another because residence time and feed preparation differ.

Run a controlled pilot with representative lots. Record feed rate, chlorine utilization, temperature, residue, pressure drop and downstream product quality. Avoid approving a new source solely from a high assay. Agree on trial quantity, sample conditioning, safety controls and success criteria with operations before the material arrives. Use the TiCl4 process-control resource to connect mineral quality with operating data.

Rutile Sand in Welding Electrodes

Welding electrode producers may use rutile sand for slag-forming and arc-performance functions. Particle size, moisture, iron balance, silica, alkalinity and trace elements can affect extrusion, coating strength, arc stability, slag detachability and weld appearance. A chemically acceptable lot may still fail if the size curve or moisture changes binder demand.

Compare the candidate with an approved control using the same binder, mixing order, extrusion pressure, drying schedule and welding parameters. Check green strength, coating concentricity, moisture after baking, arc behavior, slag removal and deposited-metal quality. Do not change both rutile source and binder at the same time. A controlled one-variable trial gives the supplier and buyer evidence they can act on.

Storage, Packaging and Transport

Use dry, intact bags or bulk packaging with a documented liner and closure. Keep rutile sand off the floor and away from open doors, roof leaks and chemicals that can contaminate the concentrate. Container floors and walls should be inspected for water, salt, residue and condensation. Desiccants or moisture indicators may be justified for long humid routes, but they do not replace a sound barrier package.

Record loading weather, container number, seal, pallet position, route and arrival condition. If a wet shipment is suspected, quarantine before blending. Re-sampling an exposed lot after it has been dried or moved can hide the original cause. Packaging or port changes should trigger a risk review and, for critical grades, a pilot shipment before full-scale purchasing.

Rutile sand supplier qualification packaging and particle-size control

Supplier Qualification Evidence

  • Mine or mineral-source identity and beneficiation plant.
  • Three or more normal production lots with full chemistry.
  • Test methods, calibration, uncertainty and reporting basis.
  • Particle-size curves and moisture data by lot.
  • Change-notification and traceability procedure.
  • Packaging, storage and transport controls.
  • Process-trial sample with agreed quantity and retain plan.
  • Complaint response, root-cause and corrective-action records.

Request evidence in a consistent template so suppliers can be compared fairly. A polished certificate is not proof of capability unless lot numbers, dates and methods are traceable. Review whether the supplier controls the mine, the beneficiation plant, the warehouse and the exporter. Multiple handoffs increase the risk of substitution or blending without notification.

Incoming Quality-Control Workflow

  1. Verify purchase order, grade, lot and declared source.
  2. Inspect seal, liner, pallet, moisture and visible contamination.
  3. Sample packages using the approved risk-based plan.
  4. Run moisture, TiO2, total iron, Cr2O3 and key penalty-element tests.
  5. Run dry sieve analysis and record fines and oversize.
  6. Compare bulk density and flow against the retained control.
  7. Release, quarantine or reject under written authority.
  8. Trend results by source, season, route and supplier.

When a result is close to a limit, do not test repeatedly until a passing value appears. Follow the retest rule agreed in the contract. Preserve raw data, spectra, sieve residues, photos and the sealed referee sample. This record supports E-E-A-T for technical decisions and reduces disputes over whether a failure was caused by mineral quality, sampling or logistics.

Investigating a Low-Assay or High-Chromium Lot

First map the result by package and increment. Compare individual results with the composite to identify segregation. Recheck calibration and reference materials, then test a retained supplier sample and a sealed buyer sample in parallel. Examine heavy-mineral fractions under magnification. If the issue is real, review mine bench, stockpile, blending, magnetic separation and screen records.

Do not blend a failed lot into conforming material without a written risk assessment. Blending may reduce an average value while creating untraceable pockets of penalty elements or fines. Corrective action should identify the point of control and the notification path. A supplier who provides transparent investigation data is more valuable than one who simply offers a replacement shipment.

Cost-in-Use Comparison

The lowest price per tonne can be the highest cost per finished tonne when a lot carries extra moisture, fines, screen residue, downtime or process waste. Calculate usable dry mineral, reaction yield, feeder performance, energy, dust collection, disposal, testing and rework. Include the cost of safety controls and inventory when supply variability forces a larger buffer.

For dual sourcing, compare several normal lots from each supplier. Keep the same process conditions and control sample. A higher-assay material may not win if it has poor size control or expensive packaging. The right decision is the lowest total cost for repeatable production and acceptable risk.

Frequently Asked Questions

Is rutile sand the same as ilmenite?

No. Rutile is primarily TiO2, while ilmenite is FeTiO3. Commercial concentrates may contain both, so the specification must state the mineralogical and chemical basis.

What does FeTiO3 assay mean?

It may mean calculated ilmenite content or may be used loosely for titanium-bearing mineral. Ask for the calculation basis and the direct TiO2 and iron results.

Why test Cr2O3?

Chromite-bearing grains can concentrate chromium and affect some downstream reactions, residues, regulations or product quality. Measure it when the application or deposit makes it relevant.

How many bags should be sampled?

The plan depends on shipment size and risk. Use multiple package positions and increments, then preserve a sealed referee sample. One top scoop is not representative evidence.

Does moisture change rutile chemistry?

Moisture does not usually change the mineral formula, but it changes as-received mass, flow, segregation and process feeding. Report dry and received basis clearly.

Which particle-size method is best?

Use the method that matches the process and validate it. Dry sieve analysis is practical for granular sand; laser diffraction can help with fines but requires correlation.

Can wet rutile sand be dried and released?

Only under an approved rework procedure. Drying may not remove contamination, segregation or mineralogical risk. Document the original condition and retest after controlled rework.

What should a COA include?

Include lot, source, date, assay basis, methods, TiO2, iron, Cr2O3, key penalty elements, moisture, size distribution, packaging and authorized release status.

Standards and Method Governance

Use current publications from ASTM International and the International Organization for Standardization as starting points for applicable sampling, chemical and particle-size practices. The buyer and supplier should record the edition, calibration status, sample preparation and internal deviations, then validate the method for the specific rutile sand grade. This makes results comparable across sites and supports defensible supplier decisions.

Request a Rutile Sand Qualification Sample

Send Hengyi Technology your application, target TiO2 or FeTiO3 basis, Cr2O3 limit, particle-size range, moisture limit, packaging format, annual volume and destination route. We can discuss candidate sources, representative lots, COA review, sample testing, pilot quantities and a side-by-side supplier qualification plan.

Contact Hengyi Technology for a rutile sand sample, technical data and commercial quotation.

Dry-Basis Calculations and Mass Balance

When rutile sand contains variable moisture, a dry-basis assay is essential for comparing suppliers. Convert the received result using the measured moisture and state the formula on the certificate. A shipment with 95% TiO2 on a dry basis may deliver less active mineral per wet tonne than a shipment with the same assay and lower moisture. Procurement should compare usable dry tonnes, not only the invoice weight. Include the moisture uncertainty in the conversion when a lot is close to the limit.

Mass balance also helps identify hidden losses. Record received weight, dried sample weight, screened fractions and any material removed as foreign matter. If the dry mass does not reconcile, investigate sample handling, dust loss and segregation. A transparent calculation protects both parties when freight, storage and reaction yield are evaluated.

Color, Surface and Foreign-Matter Inspection

Visual inspection is not a substitute for assay, but it is a fast warning signal. Compare color, luster, grain shape and visible dark inclusions with an approved retain. Sudden black, gray, green or unusually glassy grains can indicate chromite, altered ilmenite, slag or contamination. Photograph the material under controlled lighting and keep the image with the lot record.

Screen for tramp metal, wood, plastic, stones and packaging fibers. A magnet test may identify ferrous fragments but cannot characterize the mineral concentrate. Examine sieve residues separately because foreign matter often reports in the coarse fraction. Define a rejection rule for visible contamination before the shipment arrives, rather than negotiating after a production upset.

Laboratory Method Correlation

Supplier and buyer laboratories should exchange complete methods, not only instrument names. Compare grinding, drying, fusion or pressed-pellet preparation, calibration standards, drift correction, sample mass and reporting basis. Prepare a common homogenized sample and test it in both laboratories. If results differ, separate bias from repeatability using duplicates and a stable reference material.

For particle size, align sieve aperture tolerance, agitation time, brush use and treatment of agglomerates. For moisture, align dish geometry, endpoint and cooling. For chemistry, review whether results are normalized to 100% and whether loss on ignition is included. The agreed referee method should be written into the purchase specification and change-controlled.

Production Trial Design

A trial should answer a commercial question with the fewest variables. Define the candidate lot, approved control, batch size, equipment, feed rate, temperature, residence time and success criteria before testing. Use the same operators and record deviations. Measure both immediate process behavior and finished-product quality. A single successful small batch is encouraging but does not establish seasonal capability.

For chlorination, record feed stability, reaction conversion, residue and maintenance indicators. For welding electrodes, record extrusion, coating integrity, baking moisture and weld performance. For other mineral processes, define the critical output before selecting the test. Share a short trial report with the supplier so corrective actions are evidence-based rather than speculative.

Change Control and Long-Term Monitoring

Rutile sand sources can change because of mine benches, weather, stockpile age, equipment wear, screen replacement or blending strategy. Require advance notice for source, plant, packaging, test method and logistics changes. A new lot number alone does not prove that the underlying process is unchanged. Review first-lot data after every approved change.

Maintain a dashboard with TiO2, iron, Cr2O3, moisture, size, bulk density, complaints and process performance. Segment trends by supplier and source. Use warning limits to start a conversation before a failure. Annual review should confirm that the specification still reflects current equipment, regulations and customer requirements. This turns supplier qualification into a living control system.

Safety, Dust and Regulatory Review

Before approving a new rutile sand source, review the safety data sheet, occupational dust controls and any naturally occurring radioactive material requirements that apply to the deposit and destination. Heavy-mineral concentrates can generate respirable dust during unloading, screening and pneumatic transfer. Specify enclosed handling, local extraction, appropriate respiratory protection and housekeeping responsibilities. Do not infer safety from a low moisture result.

Ask for declarations on restricted substances, conflict minerals where relevant, transport classification and export documentation. A compliance gap can stop a shipment even when its chemistry is acceptable. Keep the supplier declaration linked to the exact grade, site and lot family. Reconfirm it after source or process changes.

Commercial Contract Clauses

A strong contract defines the product name, mineralogical basis, chemical limits, particle-size limits, moisture basis, packaging, sampling, certificates, change notification, claims period and referee laboratory. State who pays for testing, storage and return freight when a lot fails. Include a retain period long enough to cover delayed process complaints. Define whether partial release is allowed and who authorizes it.

Link payment or acceptance to complete documentation, not just a supplier invoice. Require the lot number on every bag, pallet and certificate. If the material is blended, require the blend date and component-lot genealogy. These clauses reduce ambiguity and preserve the technical evidence needed for a fair commercial decision.

Buyer Checklist Before First Order

  • Confirm the exact mineralogical and assay basis.
  • Approve a representative sample from more than one lot.
  • Complete chemistry, moisture and size correlation.
  • Run the intended process trial against an approved control.
  • Approve package, label, storage and transport conditions.
  • Agree on COA, sampling, retest and arbitration rules.
  • Record source, plant, change-control and complaint contacts.
  • Set a review date after the first commercial shipment.

Why Consistency Wins Over a One-Time High Assay

Procurement teams often compare suppliers using the best certificate they have seen. A more useful comparison is the width and predictability of the normal distribution. A consistent rutile sand with a slightly lower average can outperform a sporadic high-assay grade because operators can set feeders, reaction conditions and inventory rules with confidence. Review median, range, outliers and the supplier’s response time, not only the top result.

Use qualification lots to establish a baseline, then compare each commercial shipment against that baseline. When the material remains inside the agreed chemical, physical and process windows, routine release is efficient. When it moves toward a warning limit, early technical discussion can prevent a costly rejection. This is the purchasing logic behind a documented, evidence-led rutile sand program.

Titanium dioxide pH and conductivity screening for waterborne paint stability

Titanium Dioxide Moisture Content and Caking: Loss on Drying, Dispersion Risk, Storage and Supplier Qualification

Quick answer: titanium dioxide moisture content should be controlled because even a small increase can change powder flow, encourage caking, interfere with weighing and feeding, and amplify viscosity or dispersion differences in coatings, plastics and inks. Buyers should not approve a lot from one moisture number alone. They should define the test method, conditioning, sampling plan, packaging integrity, acceptance range and application confirmation. Compare loss on drying with an approved retain, inspect lumps and flowability, measure dispersion and viscosity in the intended formulation, and investigate whether moisture entered during manufacture, storage or transport.

This guide is written for procurement, quality-control, formulation and production teams that receive rutile or anatase TiO2. It explains how to build a defensible incoming test, distinguish water from other volatile loss, diagnose caking, correlate laboratory results with process behavior and qualify a supplier for humid routes. The commercial purpose is to reduce blocked feeders, slow dispersion, shade variation, unplanned drying, rejected deliveries and disputes based on incomparable test methods.

Titanium Dioxide Moisture Content: Decision Table

Finding Likely questions Best confirming checks
High loss on drying, free-flowing powder Adsorbed water or method temperature difference Karl Fischer, blank, time-to-constant-mass
Normal moisture, hard lumps Compaction, pressure, surface treatment or previous wetting Sieve residue, crushing force, packaging history
High moisture and soft cake Humidity ingress or condensation Top-middle-bottom sampling, seal inspection, logger data
Normal COA, high customer result Sampling, storage or method mismatch Sealed split sample and laboratory correlation
Viscosity rise with small moisture change Dispersant demand or formulation sensitivity Controlled paint grind and flow curve
Feeder instability Flowability, electrostatics or agglomeration Bulk density, angle of repose and feed-rate trial

Why Moisture Matters in Titanium Dioxide

Titanium dioxide is an inorganic pigment with a high-energy surface. Commercial grades also contain inorganic coatings such as alumina or silica and may include organic surface treatment. These surfaces interact with atmospheric water. The amount retained depends on grade chemistry, surface area, particle structure, humidity, temperature and time. Water can form a thin adsorbed layer without making the powder visibly wet. That layer changes particle-to-particle forces and can affect the way powder flows, compacts and wets into a liquid or polymer.

The effect is application-specific. In a waterborne paint, a small amount of water may not change total formulation water much, yet it can alter local wetting during pigment addition and contribute to inconsistent dispersant response. In solventborne systems, uncontrolled water may affect resin compatibility, gloss or storage stability. In plastics, moisture can create feeding variation, porosity or hydrolytic risk in sensitive polymers. Therefore the useful question is not simply “Is the moisture low?” but “Is it controlled at a level that keeps the customer process repeatable?”

Moisture Content Is Not Always the Same as Loss on Drying

Many certificates report loss on drying, or LOD, as a moisture proxy. The sample is weighed, heated under defined conditions and weighed again. Any lost mass is reported as a percentage. That loss may include adsorbed water, residual process water and other volatile matter. Results depend on temperature, time, sample mass, dish geometry, airflow and whether the endpoint is fixed time or constant mass. Two laboratories can test the same TiO2 and obtain different values while both follow their own procedures correctly.

Karl Fischer titration measures water more selectively, but sample preparation is critical because water must be extracted or released from the solid. Oven-coupled Karl Fischer can be useful for difficult powders. Thermogravimetric analysis shows mass loss versus temperature and helps separate loosely bound water from higher-temperature volatile loss. No method is automatically superior for every purchase specification. The supplier and buyer should select a primary release method, document it completely and use secondary methods during investigation.

Designing a Reproducible Loss-on-Drying Test

Define the balance resolution, oven type, calibration status, sample mass, dish material, layer thickness, drying temperature, drying time, cooling procedure and calculation. Use clean, dry, tared dishes and transfer the sample quickly. A thick bed can trap moisture and produce a low result at fixed time, while a very thin layer can exaggerate exposure during preparation. Cool samples in a desiccator before weighing so they do not regain moisture from laboratory air or create buoyancy errors while hot.

Run duplicates and establish repeatability with a stable reference lot. If the duplicate difference is larger than the proposed specification window, improve the method before judging suppliers. Include a blank or verified dish stability where necessary. Record room humidity because a hygroscopic grade can change during weighing. A time-to-constant-mass study helps select an appropriate duration. Once validated, do not silently change temperature or endpoint merely to shorten testing.

Sampling Is Often the Largest Source of Error

A bag or bulk container may not be uniform after humid transport. Material near a damaged seam or cold wall can differ from the center. A scoop from the open top is not automatically representative. Create a plan based on shipment size, package count and risk. Select bags from different pallet positions and take increments from more than one depth when safe. Keep package identity so an isolated damaged bag is not blended into an apparently acceptable composite.

Place moisture samples immediately into dry, airtight containers with minimal headspace. Label lot, package, position, date, time and sampler. Do not leave a jar open while other tests are performed. If a dispute is possible, prepare sealed supplier, buyer and referee portions from the same homogenized increment. Photograph packaging and note condensation, tears, damp stretch wrap, flattened bags or hardened corners before handling destroys the evidence.

Titanium dioxide moisture content comparison and dispersion viscosity test

How Moisture Creates Caking

Caking develops when particles form contacts strong enough to resist normal handling. Moisture can dissolve trace soluble material at contact points; later drying leaves bridges. Capillary forces can pull particles together, and pressure from stacked pallets increases contact area. Repeated temperature changes may cause moisture migration and condensation inside a package. Fine pigment consolidates over time even without excess water, so a caking investigation must consider humidity, compaction, surface treatment, storage duration and vibration together.

Soft lumps that collapse under light pressure are different from hard cake that requires tools or high shear. Define a practical rating using sieve residue, crushing force and recovery method. Record the mass retained on a specified sieve before manually breaking lumps. Then apply a defined force and repeat. The difference indicates whether the agglomerates are weakly compacted or strongly bonded. A visual statement such as “some lumps” is not sufficient for supplier comparison.

Packaging Integrity and Humidity Barrier

Paper bags are convenient but their moisture barrier depends on ply construction, liner, valve design and sealing. Polyethylene liners and laminated structures reduce ingress, but pinholes, poor heat seals and valve channels can compromise protection. Pallet wrapping protects against splash yet may trap condensation if warm product enters a cold environment. Bulk bags and silos require attention to liner closure, venting and dry-air transfer.

A supplier qualification should document package specification, seal inspection, pallet pattern, maximum stack height and storage recommendation. Conduct a transport simulation or monitored pilot shipment for humid destinations. Weigh selected packages before and after exposure if sensitivity warrants it. Temperature and relative-humidity loggers provide context, but placement matters. One device near a container door does not represent every pallet. Packaging changes should require notification because a cheaper bag can alter delivered quality without changing the TiO2 manufacturing process.

Warehouse and Container Condensation

Condensation occurs when a surface falls below the dew point of surrounding air. A cold TiO2 shipment opened in a warm humid warehouse can collect water quickly. Conversely, warm humid air trapped in a container can condense during nighttime cooling. The powder may be dry at the factory and wet at receipt, making lot genealogy and logistics records essential. Receiving teams should avoid opening cold packages until they equilibrate under controlled conditions when condensation risk is high.

Store bags off the floor, away from exterior walls, leaks and direct temperature cycling. Use first-in, first-out rules and respect maximum stack height. Record warehouse humidity in problem seasons. If material is transferred pneumatically, confirm that conveying air is dry and that filters or coolers do not introduce condensate. A recurring moisture complaint limited to one route or warehouse usually calls for logistics correction rather than a formulation change.

Flowability, Bulk Density and Feeding Performance

Moisture-related cohesion changes angle of repose, aerated and tapped density, discharge behavior and feeder consistency. A powder can meet chemical composition yet cause variable screw loading or bridging in a hopper. Measure bulk density with one agreed procedure because pouring height and vibration strongly influence the result. Compare an exposed sample with a retained control and observe whether the powder floods, rat-holes or adheres to surfaces.

For plastics and powder coatings, run a feeder trial at production-relevant rates. Record mass delivered over short intervals rather than only an average. Variation can create opacity drift even when total TiO2 addition is correct over a long batch. If pneumatic transfer is used, note pressure, filter loading and line deposits. These process observations convert an abstract moisture limit into a performance-based acceptance rule.

Dispersion Risk in Waterborne Coatings

Waterborne formulations may appear tolerant of moisture, but TiO2 surface hydration can affect the first seconds of wetting. Dispersant adsorption, pH, electrolyte balance and thickener interaction determine whether the pigment develops full opacity with acceptable viscosity. A small powder difference can become significant in a high-PVC formula or when dispersant dosage is close to the minimum. Compare lots using a fixed addition order, water quality, pH, dispersant level, blade geometry, speed and temperature.

Measure grind development versus time, not only the final Hegman reading. Record mill-base viscosity, foam, temperature and power draw. Let down into the same fresh base and evaluate low-, medium- and high-shear viscosity, opacity, tinting strength, gloss and syneresis. The existing titanium dioxide oil absorption test guide explains dispersant-demand screening; moisture testing should complement rather than duplicate that page.

Solventborne Coatings, Inks and Sealants

In a solventborne system, water may be incompatible with resin or solvent, causing haze, seediness or storage change. TiO2 with hard moisture-related agglomerates can increase filtration pressure and reduce gloss. Evaluate the pigment in the intended resin because a generic paste may hide the problem. Control solvent water content, resin batch and laboratory humidity so the test isolates the pigment lot.

For inks, examine fineness, color strength, undertone, viscosity and filter residue. For sealants, monitor wetting, rheology, extrusion and cure because moisture-sensitive chemistry may respond differently. Do not dry the candidate powder before the comparison unless the commercial process includes drying. Artificially drying a failed sample can diagnose cause, but it cannot prove that the delivered lot meets the original requirement.

Thermoplastics and Masterbatch

TiO2 is used in polyolefins, PVC, engineering plastics and masterbatch. The pigment itself may carry limited water, but sensitive polymers can magnify the effect. Moisture can contribute to voids, surface defects, unstable feeding or degradation in hydrolysis-prone resins. Establish whether the customer process includes resin and pigment drying, and whether the TiO2 package is resealed after partial use.

Run a controlled masterbatch trial with fixed screw design, throughput, temperature profile and let-down ratio. Record torque, pressure, strand condition, pellet appearance, filter pressure and dispersion. Produce plaques or film for opacity, color and defect counts. The rutile versus anatase masterbatch guide covers grade selection; this article owns moisture, caking and delivered-powder control.

Moisture, Surface Treatment and Grade Design

Commercial rutile grades may use alumina, silica, zirconia or organic treatment to balance durability, dispersion and processability. These treatments influence water adsorption and the temperature needed to release it. A numerical comparison is meaningful only among grades tested by the same method. A grade with slightly higher LOD may still deliver better dispersion because its surface treatment is optimized for the application.

Ask suppliers to identify the intended application class and control strategy without demanding confidential formulation details. Important evidence includes multiple-lot data, method precision, control charts and change-management rules. A supplier should explain whether the moisture specification reflects manufacturing capability, packaging protection or customer performance. Marketing statements such as “low moisture” have little value without a method and lot distribution.

Setting an Acceptance Limit

Do not copy a competitor’s number without correlation. Start with several conforming lots, measure them by the agreed method and connect results to application performance. Include realistic shipping exposure. Set an alert limit where investigation begins and a rejection limit where process risk becomes unacceptable. Consider method uncertainty and sample heterogeneity. A limit tighter than combined sampling and test variation will create false disputes.

Specifications can include both a numeric moisture or LOD maximum and functional requirements for caking, sieve residue, dispersion and viscosity. This prevents approval of a dry but badly compacted powder and rejection of a slightly higher result that performs normally. Define rounding rules and whether results are reported on received basis. State which laboratory is authoritative and how split-sample arbitration works.

Incoming Quality-Control Workflow

  1. Inspect seals, pallet wrap, bag condition and evidence of condensation.
  2. Verify product, grade, lot, manufacturing site and COA.
  3. Select packages according to the approved risk-based sampling plan.
  4. Seal moisture portions immediately and preserve referee samples.
  5. Run duplicate LOD or the specified primary moisture method.
  6. Inspect flow, lumps and defined sieve residue before aggressive handling.
  7. Compare bulk density and representative application performance.
  8. Trend the result against supplier and internal historical data.
  9. Release, quarantine or reject under documented authority.

A receiving decision should be timely because repeated opening and warehouse exposure changes the evidence. If the result is near a limit, repeat according to a predefined rule rather than testing until one value passes. Preserve all raw weights, photographs, instrument IDs and calculations. This traceability strengthens E-E-A-T for technical content and, more importantly, creates a fair commercial record.

Titanium dioxide moisture content and caking incoming quality control

Supplier–Buyer Laboratory Correlation

When results disagree, begin with sealed split samples. Exchange complete procedures and compare oven calibration, temperature mapping, balance resolution, sample mass, dish size, drying time, desiccator use and rounding. Test a stable reference material in both laboratories. If each laboratory is repeatable but biased, a conversion or harmonized method may resolve the issue. If repeatability is poor, method improvement comes before supplier judgment.

Next compare sampling. The supplier may test a production composite before packing, while the buyer tests one exposed bag after transport. Both results can be true. A correlation study should include factory samples, unopened delivered packages and deliberately humidity-conditioned material. This identifies whether the difference arises during production, packaging, logistics, storage or analysis.

Root-Cause Investigation for a High Result

Quarantine the lot and map results by package location. Review production drying data, packing time, bag and liner lots, seal checks, loading weather, route, container condition and warehouse history. Inspect whether the outside of packages is wet or stained. Compare top, middle and bottom samples. Use Karl Fischer or thermogravimetry when LOD suggests volatile loss that may not be water.

Run a controlled drying experiment on a small investigative portion and compare flow and application behavior before and after drying. Improvement supports a moisture mechanism but does not automatically authorize rework. Evaluate whether drying changes surface treatment or contamination risk. A corrective action should address the source: dryer control, cooling before packing, improved liner, dry-air transfer, container desiccant, warehouse practice or route protection.

Common Mistakes

  • Comparing COA and incoming numbers produced by different methods.
  • Taking one scoop from the top of one bag.
  • Leaving the sample open while preparing the oven.
  • Using a fixed drying time without confirming constant mass.
  • Calling all volatile loss “water.”
  • Breaking lumps before documenting their severity.
  • Approving a lot only because it can be recovered with laboratory high shear.
  • Ignoring package position and condensation history.
  • Setting a limit narrower than method precision.
  • Changing packaging without customer notification.

Purchase Specification Checklist

  • Exact TiO2 grade, crystal form, application class and approved site.
  • Primary moisture or LOD method with complete parameters.
  • Maximum result, alert level, rounding and retest rule.
  • Sampling plan, sample container and maximum exposure time.
  • Caking rating, sieve size, retained mass and permitted recovery.
  • Bulk-density and flowability method where feeding is critical.
  • Application test for dispersion, viscosity, opacity and defects.
  • Bag, liner, valve, pallet and storage requirements.
  • COA format, retains, change notification and complaint timing.
  • Referee laboratory and disposition authority.

Supplier Qualification Questions

  • Which method generates the COA moisture result?
  • What are typical, alert and specification values across normal lots?
  • How are oven, dryer and packing conditions controlled?
  • Is product cooled before bagging to prevent condensation?
  • What humidity barrier does the commercial package provide?
  • How are bag and liner suppliers qualified?
  • Can the supplier provide control-chart or multi-lot evidence?
  • Which changes require customer notification?
  • How are humid-route complaints investigated?
  • Can the supplier support a sealed split-sample study and pilot shipment?

Cost-in-Use and Procurement

A cheaper TiO2 lot can be expensive if caking slows unloading, increases dispersion time or causes unstable feeding. Calculate the total cost of additional screening, drying, labor, energy, filter changes, downtime, rework and customer risk. Include the cost of protective packaging and monitored transport. The right commercial comparison is cost per conforming finished product, not only price per tonne of pigment.

For dual sourcing, qualify each grade independently. Similar TiO2 assay does not guarantee the same moisture response because surface treatment and packaging differ. Maintain the correct method and limits with each supplier code. If the customer process is highly sensitive, consider a narrower internal alert supported by rapid application screening rather than imposing an unrealistic universal limit.

Frequently Asked Questions

What is an acceptable titanium dioxide moisture content?

There is no single universal value. The acceptable range depends on grade, method, surface treatment, packaging and application sensitivity. Establish a limit from multi-lot capability and performance correlation.

Is loss on drying equal to water content?

Not always. LOD measures all mass lost under the selected conditions. Karl Fischer is more selective for water, while TGA helps show when different volatile fractions leave the sample.

Can caked TiO2 still be used?

Only after documented evaluation. Soft compaction may recover, but hard cake can impair feeding and dispersion. Confirm sieve residue, crushing behavior and application performance with the equipment available to the customer.

Why is the buyer result higher than the COA?

Possible causes include method differences, humidity exposure during shipping, damaged packaging, condensation, unrepresentative sampling or laboratory handling. Use sealed splits and compare complete procedures.

Should TiO2 be dried before use?

Drying is process-specific. It may help sensitive polymers, but unnecessary drying adds cost and can introduce contamination. Follow a validated customer procedure and supplier guidance.

Does high moisture always increase paint viscosity?

No. The response depends on dispersant, pH, surface treatment and formulation. Some systems show little change; others are highly sensitive. A controlled mill-base trial is the best evidence.

How should samples be stored?

Use dry airtight containers with minimal headspace, clear identification and controlled temperature. Preserve unopened referee samples where commercial risk is significant.

Can package changes affect moisture?

Yes. Liner thickness, valve construction, seals and pallet protection influence humidity ingress. Packaging changes should be evaluated and controlled through supplier change notification.

Which test predicts feeder problems?

No single moisture number is sufficient. Combine moisture with caking, sieve residue, bulk density, flow testing and a representative feeder trial.

How many lots should be used for qualification?

Use several normal production lots across meaningful time and, where possible, humid-season or route exposure. One optimized sample does not establish capability.

Related Titanium Dioxide Resources

Use the TiO2 COA and lot-release guide to prioritize certificate values, the undertone and whiteness testing guide for color approval, and the low-opacity troubleshooting guide when hiding power is the main failure. These pages form a technical cluster without targeting the same primary intent.

Request a Sample and Humidity-Risk Review

Send Hengyi Technology your application, resin or polymer, current TiO2 grade, moisture method, acceptance limit, package size, destination climate, storage time, annual volume and the caking or dispersion problem you are seeing. We can discuss candidate grades, representative commercial-lot samples, COA documentation, packaging options and a side-by-side incoming qualification plan.

Contact Hengyi Technology to request a titanium dioxide sample, technical data and commercial quotation.

Final Purchasing Principle

Titanium dioxide moisture content is a delivered-quality variable, not an isolated laboratory number. Reliable control combines a precise method, representative sampling, humidity-resistant packaging, logistics records, caking and flow assessment, application testing and supplier change control. That system prevents false rejection caused by method mismatch, catches real transport damage and gives buyers a defensible basis for choosing a TiO2 supplier.

Moisture Trend Analysis and Annual Review

A single pass or fail decision cannot show whether a supplier process is drifting. Record every incoming result by grade, manufacturing site, lot date, season, package type and route. Use control charts to distinguish normal variation from a sustained shift. Review caking observations and application results beside the moisture data; a stable average with increasing hard-lump complaints may indicate packaging or stacking changes rather than dryer performance. Seasonal analysis is especially useful for humid destinations and long ocean routes.

At least annually, review method precision, supplier capability, complaint history and the continued relevance of the limit. Requalify after changes to surface treatment, drying equipment, production site, liner, bag valve, pallet configuration or logistics route. Preserve enough representative retains to investigate delayed complaints. This ongoing review converts incoming inspection from a gatekeeping exercise into a preventive supplier-development system and supplies credible technical evidence for purchasing decisions.

Standards and Method Governance

Supplier and buyer laboratories should document equipment calibration, sampling, conditioning and method deviations with the same discipline used in recognized standards systems. Use current publications from ASTM International and the International Organization for Standardization as authoritative starting points when selecting applicable test practices, then validate the agreed method for the specific commercial TiO2 grade and end-use formulation. Record the edition, temperature, endpoint and any internal modification so results remain comparable across sites and over time.

Pigment paste freeze thaw stability testing and supplier qualification

Pigment Paste Freeze Thaw Stability: Viscosity Drift, Separation, Color Strength and Supplier Qualification

Quick answer: pigment paste freeze thaw stability should be qualified with a controlled cycle that reflects the lowest credible transport temperature, hold time, thawing method and number of exposures. A paste should not be approved because it looks homogeneous after stirring. Compare an exposed sample with an unexposed retain for redispersibility, viscosity at several shear conditions, syneresis, hard sediment, fineness, filtration residue, pH, color strength, L*a*b* values, rub-up and performance in the intended coating, ink, fertilizer coating or seed-treatment formulation. A reliable supplier also defines storage limits, packaging, change control and a cold-weather complaint protocol.

This guide is for buyers, formulation laboratories, quality teams and production managers who receive pigment paste through winter routes or store it in unheated warehouses. It explains how to create a defensible qualification method, diagnose damage, write a purchase specification and distinguish recoverable separation from irreversible loss of dispersion. The commercial goal is simple: prevent rejected deliveries, shade corrections, blocked filters and production downtime while selecting a supplier that can control cold-chain risk.

Pigment Paste Freeze–Thaw Stability: Decision Table

Observation after thawing Likely mechanisms to investigate Best confirming checks
Thin liquid layer with soft sediment Temporary density separation or weak structure recovery Controlled remixing, viscosity recovery and strength comparison
Hard compact sediment Irreversible flocculation, dispersant desorption or binder collapse Spatula test, grind gauge, microscopy and application drawdown
Viscosity rises sharply Particle networking, thickener association or partial freezing of carrier Flow curve, temperature equilibration, pH and solids
Viscosity falls and syneresis increases Structure breakdown, emulsion damage or biocide/thickener imbalance Low-shear viscosity, storage observation and compatibility test
Color strength changes with normal appearance Subvisible flocculation or incomplete redispersion Controlled tint, rub-up, spectral data and staged remixing
Filter pressure rises Hard agglomerates, gel particles or frozen skin fragments Defined-mesh filtration and retained-residue examination

Why Pigment Paste Freeze Thaw Stability Can Fail at Low Temperature

A pigment paste is a structured dispersion, not simply colored liquid. Pigment particles are kept apart by wetting agents, polymeric dispersants, surfactants, resin or protective colloids. The continuous phase may contain water, solvent, glycol, humectant, salts, neutralizer, thickener, defoamer, preservative and other ingredients. Cooling changes the balance among these components. Ice formation in a waterborne paste concentrates dissolved materials in the remaining liquid, pushes particles together and creates local gradients in pH, electrolyte level and polymer concentration.

When the product thaws, the original particle spacing may not return. Dispersant can desorb or bridge between particles, a latex or soluble polymer can lose colloidal stability, and the rheology network can rebuild differently. Even when the entire package does not become visibly solid, repeated subzero excursions can create localized freezing near the drum wall. A single temperature reading taken after arrival cannot reconstruct that history.

Solventborne systems can also suffer low-temperature effects. Resin solubility, wax crystallization, viscosity and surfactant behavior change with temperature. The correct qualification method therefore depends on carrier chemistry. Suppliers should state whether “protect from freezing” is a strict damage limit, a conservative handling instruction or a temperature below which pumping and sampling become unreliable.

Freeze–Thaw Resistance Is Not the Same as Normal Shelf Life

Ambient shelf-life testing asks whether a paste remains usable during its declared storage period under recommended conditions. Freeze–thaw testing asks whether a short abnormal exposure causes a permanent change. Heat aging and freeze–thaw cycling stress different mechanisms; passing one does not predict the other. A paste may remain stable for twelve months at 23°C yet fail after one freeze, while another may survive several cold cycles but slowly settle during ordinary storage.

Keep the programs separate in specifications and reports. Define shelf life by time and temperature. Define freeze–thaw resistance by sample size, container, cooling profile, minimum temperature, hold period, thawing profile, number of cycles and post-cycle conditioning. Report both the immediate condition and delayed behavior after several days because some structures continue to rebuild or separate after thawing.

The ASTM D2243 listing describes a recognized freeze–thaw approach for water-borne coatings. Pigment-paste buyers should treat such standards as a framework and validate a product-specific method rather than assuming that a coating method automatically covers every concentrated colorant.

Map the Real Cold-Chain Risk Before Choosing a Test

Start with the shipping lane and handling system. Record origin, destination, transit time, likely outdoor temperatures, container type, consolidation points, customs delays and warehouse conditions. Air freight, ocean freight, rail and road transport create different exposure profiles. A drum next to an uninsulated container wall may experience a lower temperature than one in the center of a pallet. Small pails cool faster than intermediate bulk containers.

Ask logistics providers what temperature data are available and whether shipments enter heated facilities at night. Examine previous winter complaints by route and package position. If annual demand justifies it, place calibrated data loggers in representative shipments. The goal is not to design the harshest imaginable test; it is to reproduce credible commercial risk with a safety margin.

When a supplier claims a minimum storage temperature, request the method and evidence behind it. “Stable to −10°C” is incomplete without duration, cycle count, container geometry and acceptance criteria. A brief laboratory exposure of 100 mL can cool and thaw very differently from a 200 kg drum. Use laboratory screening to compare formulations, then confirm the selected grade in realistic packaging or a pilot shipment.

Design a Reproducible Pigment Paste Freeze Thaw Stability Protocol

A written protocol should identify the approved reference lot, candidate lot, unexposed control, sample mass, headspace, container material and closure. Precondition all samples at the same temperature and homogenize them by the approved method before filling test containers. Prepare independent replicates rather than repeatedly testing one jar. Randomize labels when visual judgment may be biased.

Define the cooling chamber set point and verify the actual sample temperature. Air temperature alone may not show whether the sample core froze. Use a representative instrumented sample when necessary. Hold at the minimum temperature long enough for the defined mass to equilibrate, then thaw under a controlled condition. Forced heating can create gradients or damage that would not occur in normal handling; uncontrolled room thawing can also vary widely.

A cycle begins only after the sample reaches the specified low-temperature condition and ends after complete thawing and equilibration. State whether the sample is mixed between cycles. Mixing after every cycle may hide cumulative damage; never mixing may exaggerate separation compared with normal warehouse practice. Many programs evaluate after one, three and five cycles to understand the progression rather than relying on one final result.

Recommended Test Sequence

  1. Inspect and photograph the unopened sample at the defined observation temperature.
  2. Measure any clear layer, syneresis, skin, gel, lumps or package deformation.
  3. Perform a gentle spatula assessment before mechanical mixing.
  4. Record the energy and time required to reach visual uniformity.
  5. Measure low-, medium- and high-shear viscosity at controlled temperature.
  6. Check pH, density, solids and conductivity where relevant.
  7. Run fineness, filtration residue and microscopy if available.
  8. Prepare equal-dose and strength-adjusted application drawdowns.
  9. Measure color strength, L*, a*, b*, ΔE, gloss and rub-up.
  10. Hold the remixed sample and repeat critical checks after 24 hours and seven days.

This order preserves evidence. Aggressive mixing before inspection can destroy the pattern that explains the failure. Record every intervention. “Mixed until uniform” is not reproducible; state blade type, diameter, speed, duration, container size and product temperature. The work required to recover a paste is itself a commercial result because customers may not have high-shear equipment at the receiving point.

Pigment paste freeze thaw stability dispersion and redispersibility test

Visual Inspection Before Remixing

Open the container only after the sample reaches the specified evaluation temperature. Condensation on a cold open sample can change water content, so allow sealed equilibration when appropriate. Observe the surface, wall and bottom. Note a clear liquid layer, foam, skin, crystals, granules, rubbery gel, cracked mass, odor or package pressure. Measure the height or volume of any separated layer instead of writing only “slight separation.”

Use a clean spatula to probe the bottom at several locations. Soft sediment that lifts easily is different from a hard cake bonded to the container. Record whether the blade reaches the bottom, whether lumps smear or remain intact, and whether the product flows back into the channel. A simple redispersibility scale can be useful if photographs and operator training define each rating.

Do not approve solely because the paste becomes visually smooth. Subvisible agglomeration may reduce tinting strength, change undertone or load filters. Conversely, a product with modest syneresis may fully recover and perform normally. Visual findings guide the analytical work but do not replace it.

Viscosity Recovery and Flow-Curve Testing

Temperature has a large direct effect on viscosity, so exposed and control samples must be measured at the same equilibrated temperature. Record rheometer or viscometer model, geometry or spindle, speed or shear rate, sample conditioning, rest time and reading time. A single low-shear number may miss damage that appears during pumping or application.

Measure a flow curve when possible. Low-shear viscosity and yield stress relate to settling and package stability; medium shear relates to mixing and pumping; high shear relates to coating, printing or spray transfer. Compare the complete curve, thixotropic loop and recovery after shear. Freeze damage can increase low-shear structure while leaving high-shear viscosity similar, or it can destroy yield structure and increase settling risk.

Establish method precision before setting a tight tolerance. If duplicate control measurements vary by eight percent, a five-percent acceptance band is not defensible. Use an alert limit for drift and a rejection limit linked to production performance. Trend the exposed-to-control ratio by cycle number because a gradual change may reveal a marginal formulation even when the final value remains inside specification.

Hard Settling, Soft Settling and Redispersibility

Density differences naturally drive pigments downward. A well-designed paste uses particle stabilization and rheology to slow settling and keep sediment recoverable. Freezing can compress the particle bed or alter the structure that supports it. Hard settling is particularly serious because ordinary drum rolling or low-speed stirring may not restore the product.

Quantify recovery with a defined mixing ladder. Begin with the supplier’s normal instruction. If the paste remains nonuniform, increase time or energy in recorded steps. Take samples from the top, middle and bottom and compare solids, density or color strength. Uniform appearance at the surface does not prove that the bottom is recovered.

If high shear can recover a laboratory jar but the commercial customer receives a sealed drum with only a recirculation pump, the product has not passed a practical requirement. Supplier qualification must match the equipment available at the destination. Packaging design, agitator access and minimum order quantity can influence the decision as much as formulation chemistry.

Fineness, Filtration and Agglomerate Detection

A grind gauge identifies a coarse tail but may break weak agglomerates under the blade. Use one trained method, clean equipment and a defined interpretation point. Compare the control and exposed sample after equal conditioning. An increase in scratches or particles suggests irreversible association, skin fragments or contamination.

Filtration is often more predictive for ink, spray and precision-coating applications. Pass a defined mass through the production-relevant mesh or filter at controlled pressure and temperature. Record flow time, differential pressure, retained mass and appearance. Examine whether the residue is colored pigment, translucent polymer gel, packaging debris or dried skin. Each points to a different corrective action.

Microscopy can reveal flocculate morphology and help distinguish large soft clusters from hard particles. Particle-size instruments require careful dilution because the dilution medium can redisperse or further destabilize the sample. Use the method as comparative evidence, not an isolated certificate number.

Color Strength and Shade After Cold Exposure

Freeze damage can change optical performance before it becomes obvious in viscosity. Prepare exposed and control samples in the same fresh base at equal paste dosage, using identical weighing, mixing, film thickness and drying. Report relative tinting strength with L*, a*, b*, ΔE and visual undertone. The International Commission on Illumination provides authoritative colorimetry context, but the purchase agreement must still define the exact formula, illuminant, observer and instrument geometry.

Run a rub-up test when flocculation is possible. A larger rubbed-versus-unrubbed difference after cycling indicates that mechanical action changes pigment distribution. Also prepare a strength-adjusted drawdown: alter candidate dosage to match color depth, then evaluate remaining hue, gloss and opacity. This separates a simple strength shift from a broader compatibility failure.

Use an approved retained paste as the reference, not a theoretical color target. Protect the retain from freeze exposure, evaporation and repeated contamination. When replacing it, bridge old and new standards with replicate tests so historical trends remain meaningful.

pH, Conductivity, Solids and Density Diagnostics

In waterborne products, pH affects dispersant ionization, thickener efficiency, biocide performance and resin compatibility. Freezing can create local concentration gradients, and volatile neutralizers may be lost if the container leaks or is repeatedly opened. Measure pH only after standard temperature equilibration and defined mixing.

Conductivity can reveal changes in soluble salt concentration or contamination, although interpretation is formulation-specific. Nonvolatile content helps distinguish true dispersion failure from water loss. Density supports concentration and dosing checks. Compare these values as a diagnostic set: high viscosity with normal solids may indicate networking, while high viscosity with increased solids can indicate evaporation or package leakage.

Do not add water, neutralizer or defoamer merely to make a failed sample pass. Any recovery experiment should be separate from acceptance testing and fully documented. A product that requires unapproved correction after routine transport is not equivalent to the qualified grade.

Application Testing Is the Final Evidence

Laboratory physical tests cannot capture every interaction in the customer’s process. Evaluate the exposed paste in a representative coating, ink, fertilizer anti-caking coating, seed treatment or other defined formulation. Fix addition order, mixing energy, letdown time, substrate, film weight and cure. Compare process observations as well as finished color.

For waterborne coatings, monitor flocculation, foam, leveling, gloss, water resistance and viscosity after letdown. For flexographic ink, include circulation, filtration, anilox transfer and drying. For fertilizer or seed coating, examine sprayability, nozzle cleanliness, coverage uniformity, dust, rub-off and color after storage. A paste can recover in a beaker yet fail under low-shear addition or narrow nozzles.

Retain application panels or coated samples and document controlled photographs. Link failures to lot, package and exposure history. This E-E-A-T evidence is more useful to buyers and search systems than unsupported claims such as “excellent freeze stability.”

Pigment paste freeze thaw stability color strength and viscosity quality control

Common Failure Mechanisms

Dispersant desorption or bridging

Concentrated solutes and close particle contact during freezing can reduce steric or electrostatic protection. After thawing, particles remain linked and strength falls. Rub-up, microscopy and increased low-shear structure support this diagnosis.

Thickener network damage

Associative or cellulosic thickeners may rebuild differently after freezing. Viscosity can rise, fall or become time-dependent. Compare flow curves and recovery after controlled shear rather than relying on one spindle reading.

Emulsion or resin destabilization

If the paste contains resin or latex, freeze concentration can destabilize polymer particles and produce translucent gel or grit. Filtration residue and compatibility testing help distinguish polymer damage from pigment agglomeration.

Crystallization of carrier components

Glycols, surfactants, waxes or other ingredients can crystallize at low temperature. Slow disappearance during warming may look like reversible grit, while persistent crystals create application defects. Thermal analysis may be useful during supplier investigation.

Packaging and headspace effects

Expansion, contraction and ice formation can stress seals, draw air or moisture through closures and create wall deposits. Compare container materials and fill levels during validation. Damaged packages should be quarantined even when the bulk paste appears acceptable.

Pigment Paste Freeze Thaw Stability: Recovery or Rejection?

Recovery is acceptable only when the written method allows it and the material returns to all critical specifications using equipment available to the customer. Soft separation that disappears under normal homogenization, followed by normal viscosity, filtration, color and application performance, may be acceptable. Record the recovery energy and verify stability after rest.

Reject or escalate material with hard sediment, persistent gel, coarse residue, abnormal odor, package leakage, significant strength or undertone shift, unstable viscosity, failed application performance or repeated separation after mixing. Do not blend a failed lot into a good lot without an approved concession and validated result. Such blending destroys traceability and can enlarge the affected quantity.

A commercial concession should identify the specific lot, destination, corrected handling, test evidence and customer authorization. It must not silently become the new standard. Recurring concessions indicate that the formulation, packaging or shipping control requires corrective action.

Supplier–Buyer Correlation Study

When supplier and buyer disagree, use sealed split samples from the same package. Include an unexposed control and exposed material. Both laboratories should follow one protocol with the same reference, mixing ladder, measurement temperature, base formulation and instrument settings. Exchange raw data, not only pass/fail conclusions.

First compare repeatability within each laboratory. If one site cannot reproduce its own result, cross-site bias cannot be assigned. Next compare the same prepared drawdown or stable panel to separate instrument difference from preparation difference. Then compare independently prepared samples to evaluate the complete method.

Agree in advance on a referee laboratory or decision route. Define sample custody, seal numbers and timing. Freeze-related disputes become harder to resolve after multiple packages are opened, warmed and mixed without records.

Packaging and Logistics Controls

Pigment paste freeze thaw stability must extend from the laboratory to commercial packaging. Qualification is incomplete if the product passes in a small jar but fails in commercial packaging. Test representative pails, drums or totes where risk warrants. Evaluate wall temperature, core temperature, thawing time and mixing access. Insulated covers, heated storage, pallet position and shipment timing may be more cost-effective than reformulating a specialized paste.

Labels should state the storage range and actions after suspected freezing. Shipping documents should identify temperature-sensitive goods where applicable. Warehouse procedures need a quarantine area, temperature records and a rule against using a frozen package before quality review. Train receiving staff to photograph condition and preserve seals.

For critical winter routes, use temperature indicators or data loggers under a defined plan. One logger at a container door may not represent every pallet, so position devices based on a mapping study. Review data with the supplier and logistics provider instead of treating the logger as a simple claim tool.

Write a Freeze–Thaw Purchase Specification

  • Exact pigment paste grade, carrier system and approved manufacturing site.
  • Recommended storage range and absolute minimum exposure condition.
  • Test sample size, container, headspace and preconditioning.
  • Minimum temperature, verified sample temperature, hold time and cycle count.
  • Thawing temperature, duration and mixing permitted between cycles.
  • Visual separation and redispersibility rating with photographic examples.
  • Viscosity method and exposed-to-control acceptance range.
  • Fineness, filtration residue, pH, solids and density limits where relevant.
  • Relative strength, L*a*b*, ΔE, rub-up and application criteria.
  • Packaging, temperature monitoring, retain samples and change notification.
  • Quarantine, referee testing, complaint response and concession authority.

Supplier Qualification for Pigment Paste Freeze Thaw Stability

  • What lowest temperature and exposure time were validated, and on what package size?
  • Were tests run on multiple normal production lots or one optimized sample?
  • What raw materials provide freeze protection and how are they controlled?
  • Does the supplier measure actual sample temperature during cycling?
  • Which properties are checked after thawing, and what are the numerical limits?
  • How are pigment source, dispersant, thickener, biocide and carrier changes managed?
  • Are lot-specific COA results actual measurements or standard statements?
  • How long are retained samples kept and how are cold-weather complaints investigated?
  • Can the supplier support a split-sample correlation and pilot shipment?
  • What packaging and winter logistics options are available?

Cost-in-Use and Procurement Decisions

Pigment paste freeze thaw stability affects total delivered cost. Compare suppliers on the cost of conforming product delivered through the real route. Include insulation, heated storage, temperature monitoring, rejected freight, disposal, emergency replacement, shade adjustment, filter changes, cleaning, downtime and customer risk. A slightly higher paste price may be economical if the formulation has a wider cold-weather margin and stronger logistics control.

Do not use freeze resistance as the only decision factor. The approved grade must also meet color, strength, compatibility, regulatory, durability and supply requirements. If freezing is rare and avoidable, logistics control may be preferable to adding a large amount of humectant that changes drying or water resistance. Make the decision from application trials and exposure data.

For dual sourcing, qualify each supplier independently. Two pastes with the same color name or Color Index may require different storage limits and recovery procedures. Purchasing systems should prevent unreviewed substitution and maintain the correct specification with each supplier code.

Pigment Paste Freeze Thaw Stability Incoming Inspection

  1. Quarantine the affected packages and stop production release.
  2. Photograph labels, seals, deformation, leakage and pallet position.
  3. Download temperature records and document route and storage history.
  4. Allow sealed packages to equilibrate under the approved condition.
  5. Select samples across exposed locations without prematurely homogenizing evidence.
  6. Compare with an unaffected retain using the approved test sequence.
  7. Contact the supplier with raw observations and split-sample availability.
  8. Release, rework, return or reject only under documented authority.

Avoid repeated retesting until one result passes. Preserve the first result and investigate assignable causes. If only part of a shipment was exposed, maintain package-level identity. Composite sampling can hide a localized failure and complicate a legitimate freight or supplier claim.

Frequently Asked Questions

How many freeze–thaw cycles should pigment paste pass?

There is no universal number. Choose cycles from credible transport risk, product sensitivity and customer requirements. Screening at one, three and five cycles often shows progression, but the agreed protocol controls the decision.

Can frozen pigment paste simply be warmed and mixed?

Only if the supplier’s validated procedure allows it and all critical properties recover. Visual smoothness is insufficient; verify viscosity, filtration, strength, shade and application performance.

Why does viscosity increase after thawing?

Particles may form a stronger network, dispersant can bridge, thickeners can associate differently, or carrier components can crystallize. Compare flow curves, solids, pH, microscopy and control samples.

Why does color strength fall when fineness still passes?

Soft flocculation can reduce optical development while breaking under a grind-gauge blade. Rub-up, spectral comparison, microscopy and controlled redispersion provide better evidence.

Is one frozen jar enough to approve a supplier?

No. Use independent replicates and multiple representative production lots. Confirm the selected formulation in commercial packaging or a monitored pilot shipment when the risk is material.

Should the sample be mixed between cycles?

The protocol must specify this. Mixing can simulate normal handling but may hide cumulative damage. Many evaluations keep samples undisturbed between cycles and mix only for the final standardized recovery test.

What temperature should be used?

Use route data and the supplier’s storage limit. The chamber set point is not the same as sample-core temperature, so validate equilibration for the chosen mass and container.

Can a passed freeze–thaw test replace shelf-life testing?

No. Freeze cycling and ambient aging stress different mechanisms. Maintain separate shelf-life, heat-aging and application-stability programs.

What information should be included in a complaint?

Provide lot and package numbers, route, dates, logger data, photographs, thawing and mixing history, raw test results, application observations and an unopened split sample when available.

How should buyers compare quotations?

Compare equal application performance and full delivered cost, including winter packaging, monitoring, recovery labor, production risk, technical support and change control—not only price per kilogram.

Related Pigment Paste Resources

Use pigment paste compatibility testing for waterborne coatings when the main risk is binder interaction, pigment paste tinting strength testing for incoming color control, the hard-settling recovery guide for normal-storage sediment, and the flexographic pigment paste guide for press-specific qualification. This article owns the freeze–thaw and cold-chain intent so the pages support one another without targeting the same primary query.

Request a Cold-Chain Sample and Quotation

Send Hengyi Technology your carrier system, target color, application, minimum route temperature, package size, expected cycle or hold condition, current paste problem, test method, annual volume and destination. We can discuss candidate pigment paste grades, representative commercial-lot samples, COA and documentation, winter packaging and a side-by-side freeze–thaw qualification plan.

Contact Hengyi Technology to request a pigment paste sample, cold-chain review and commercial quotation.

Final Purchasing Principle

Pigment paste freeze thaw stability is a system property involving formulation, packaging, logistics, recovery equipment and final application. A credible program uses a verified exposure profile, unexposed control, standardized remixing, rheology and color testing, application evidence and supplier change control. That approach prevents false approvals based on appearance, reduces unnecessary rejection of recoverable material and gives buyers a defensible basis for winter sourcing decisions.